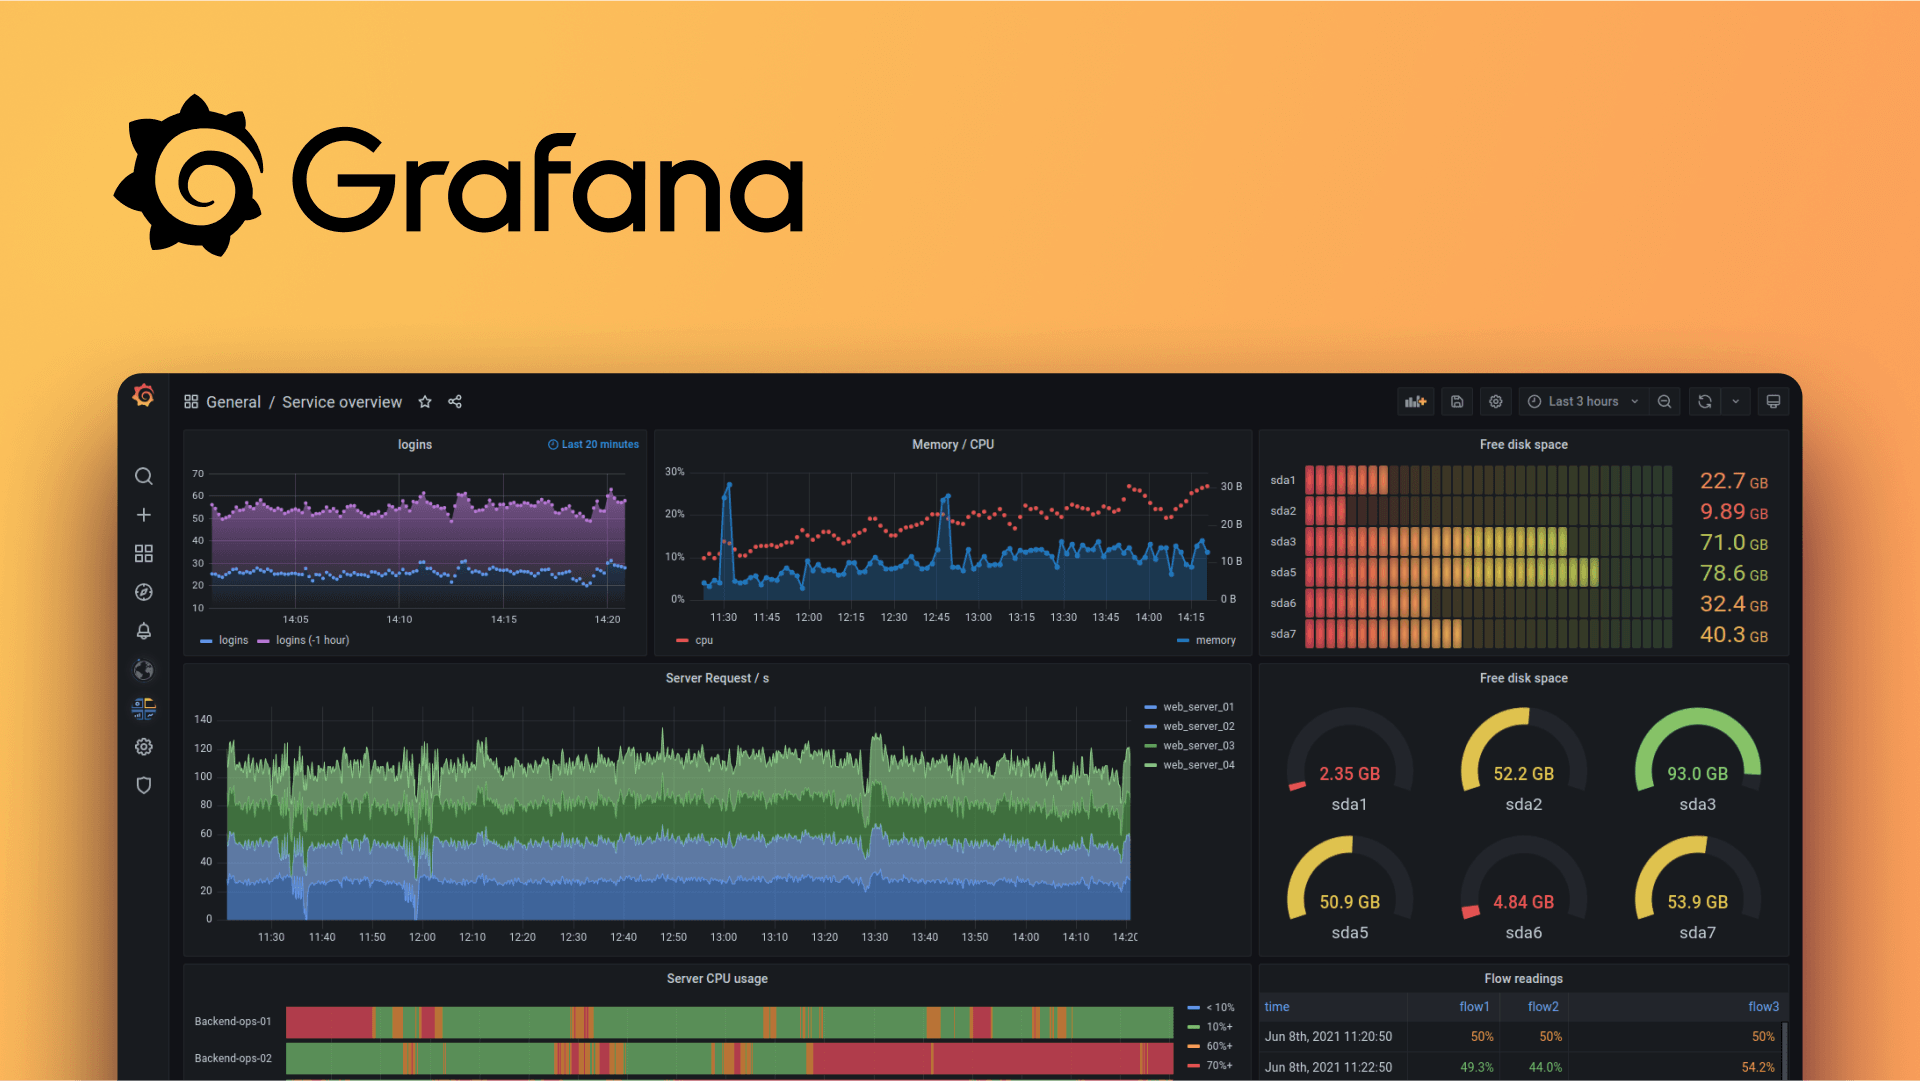
Grafana

Transform your data into actionable insights with our expert Grafana implementation services. Our team specializes in setting up and configuring Grafana, enabling you to visualize and monitor your data like never before. Don't miss out on valuable opportunities—leverage the power of Grafana to make informed decisions and drive success. Contact us today to get started on your journey to data-driven excellence!

Grafana

What is Grafana?

Grafana is an open-source analytics and monitoring platform that allows organizations to visualize and understand their data through interactive and customizable dashboards. It is commonly used in IT and DevOps for monitoring and observability purposes but can also be applied to a wide range of industries and use cases.

Key features

Data Visualization

Grafana offers a wide range of visualization options, including charts, graphs, tables, and heatmaps, making it easy to create compelling and informative dashboards.

Data Source Integration

It supports integration with various data sources, such as databases, time-series databases (e.g., Prometheus and InfluxDB), cloud services, and more.

Custom Dashboards

Users can create custom dashboards by combining panels and visualizations to monitor specific metrics or data sources.

Alerting

Grafana provides alerting and notification capabilities, allowing users to set up alerts based on defined thresholds and conditions.

Plugin Ecosystem

Grafana has an extensive plugin ecosystem that extends its functionality, enabling integration with additional data sources and services.

User Access Control

Administrators can manage user roles and permissions to ensure secure access to data and dashboards.

Templating

Grafana supports templating variables, which allows users to create dynamic dashboards that adapt to different data or environments.

Annotations

Users can add annotations to dashboards to provide context and mark specific events or changes in data.

Cross-Platform

Grafana can be used across various platforms and operating systems, including Windows, Linux, and Docker containers.

Community and Support

Grafana has an active community of users and developers, offering support, documentation, and a wealth of resources.

Scalability

Grafana is scalable and can be used for monitoring small-scale projects as well as large, complex infrastructures.

Prometheus Integration

It offers seamless integration with Prometheus for advanced monitoring and alerting capabilities.

Log and Metric Correlation

Grafana can correlate logs and metrics to provide a comprehensive view of system behavior and performance.

Snapshot and Sharing

Users can create and share dashboard snapshots or export them for offline viewing.

Time Range Controls

Grafana allows users to adjust time ranges dynamically to view historical data or real-time updates.

Dashboard Versioning

Grafana provides version control and tracking for changes made to dashboards.

Grafana implementation

Grafana implementation involves setting up and configuring the Grafana platform within an organization to enable data visualization and monitoring. During this process, data sources are connected, dashboards are created, and alerts are configured to provide valuable insights and ensure timely responses to events. Grafana empowers organizations to harness the power of their data, making it accessible and actionable through interactive dashboards.

Grafana implementation

Grafana custom module development

Grafana custom module development involves creating specialized extensions or plugins within the Grafana platform to add unique features and functionalities tailored to specific data visualization and monitoring needs. These custom modules enhance Grafana’s capabilities, allowing organizations to create highly customized dashboards and visualizations for their specific data sources and use cases.

Grafana custom module development

Grafana maintenance

Grafana maintenance involves regular updates, performance monitoring, and data backup to ensure the smooth and secure operation of the Grafana platform. It includes activities such as applying software updates, optimizing dashboard performance, and safeguarding data to ensure that Grafana continues to provide valuable insights and monitoring capabilities without disruptions.

Grafana maintenance

FAQ